Elasticsearch, Logstash, Kibana (ELK-stack) and Logspout on Docker
Contents
Update on 20th of July 2015! As the BusyBox image’s package manager opkg doesn’t work anymore I have switched to using Alpine instead. The example images and commands have been updated. At the same time the Dockerfiles have been modularized to help update the tool versions.
Note
As versions of the tools have changed considerably from the time of the original blog post, I decided to republish this instead of updating the old post. Now the tool versions are:
- Elasticseach 1.7.0
- LogStash 1.5.2
- Kibana 4.1.0
Docker-machine (0.3.0) syntax is used in the examples.
As running the microboxes with the volume containers is quite cumbersome, I have concentrated on the miniboxes and dropped the microboxes from the examples. If you are interested in using the microbox versions, please drop a line in the comments and I’ll update them as well.
General
When I was using fat containers, I used rsyslog to pass the log messages to a centralized container which had Elasticsearch, Logstash and Kibana installed. This combination is also known as the ELK-stack. After moving towards minicontainers I wanted to separate the logging logic from the application containers. Orchestration is still an issue with using multiple simple containers, but at least the application containers shouldn’t need to know anything about the logging architecture as long as they can log to stdout and stderr so that Docker can pick the logs up.
All the containers in the examples have the corresponding DockerHub builds created for them, so running the scripts is enough without the need to build the containers locally.
Separating containers
I decided to install Logstash and Elasticsearch to the same container for simplicity and separate Kibana as an own container as it’s not needed for the logging to work. I use Logspout to push the logs from the Docker socket to the Logbox.
Dockerfiles
The Dockerfiles for both Logstash + Elasticsearch (logbox) container and the Kibana (kibanabox) container can be found from github. They are pretty straightforward, although they are based on BusyBox to minimize the size. The Logbox image is about 350 MB in size.
Running
These examples expect that you have created the environment using Docker Machine 0.3.0 and it is called “dev”. If not, just substitute the IP address of your server to the commands. These commands start the Logbox, Kibanabox and Logspout on the active docker-machine controlled node.
Scripts called startLogging.sh and stopLogging.sh can be found here.
1
2
3
4
#!/bin/bash
docker run -d --name logbox -h logbox -p 5000:5000/udp -p 9200:9200 sirile/minilogbox
docker run -d -p 5601:5601 -h kibanabox --name kibanabox sirile/kibanabox http://`docker-machine ip $DOCKER_MACHINE_NAME`:9200
docker run -d --name logspout -h logspout -p 8100:8000 -v /var/run/docker.sock:/tmp/docker.sock progrium/logspout syslog://`docker-machine ip $DOCKER_MACHINE_NAME`:5000
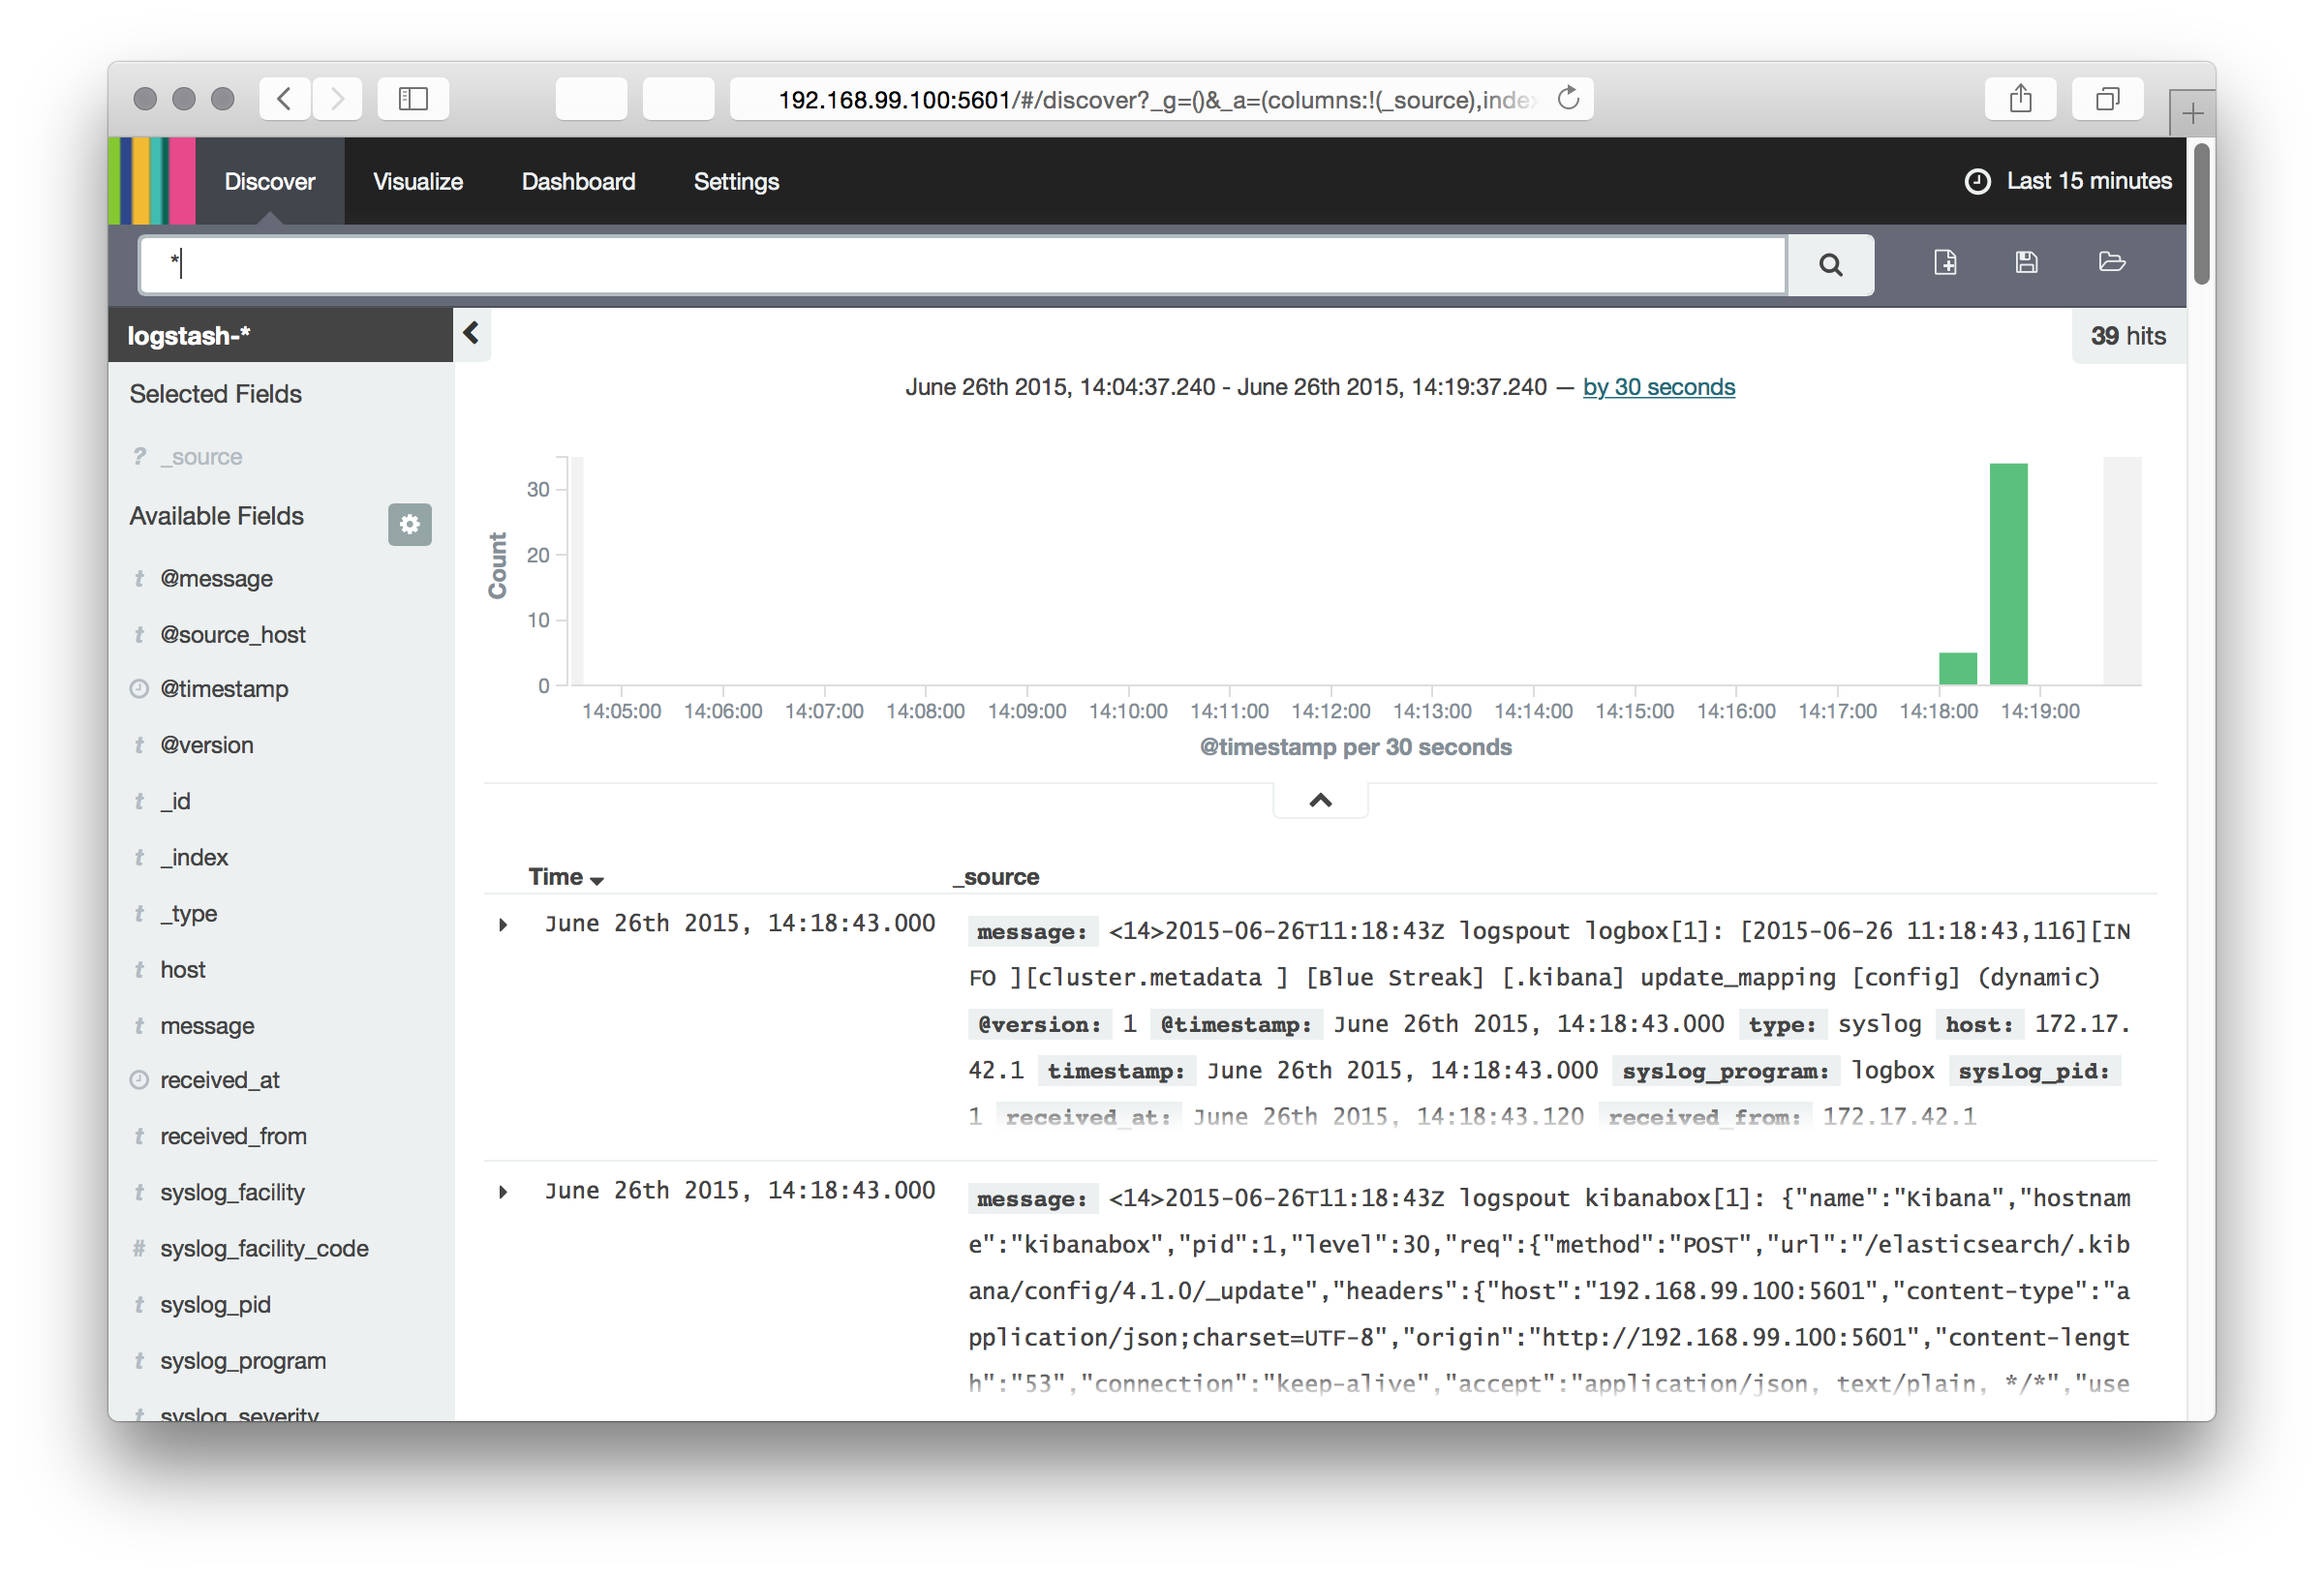
After starting the services the Kibana UI can be found from the port 5601. For example http://192.168.99.100:5601.
When you access Kibana for the first time, it asks you to confirm the time field name. Choose @timestamp. Then you see the listing of the index and can choose Discover from the top bar which takes you to the Kibana dashboard showing the log messages.

Adding more nodes
On the subsequent nodes only the LogSpout container needs to be run and it should be pointed to the server which has Logbox running. If service discovery is handled by Consul (like described here), then DNS can be used to locate the logging server instead of relying to docker-machine.
Troubleshooting and Issues
UDP
At first after having everything running I still couldn’t get Logspout messages to go through to the Logstash container. I couldn’t find any error messages and if I used telnet to directly connect the Logstash container in port 5000, my messages showed up nicely.
After battling for a couple of hours I realized that UDP isn’t automatically supported when exposing ports to the host. Instead it needs to be manually specified with adding “/udp” after the -p parameter.
After adding the parameter the logging system began to work as expected.
Syslog message parsing
Another issue I faced were a lot of parsing failures for the log messages. It was caused by Logspout using ISO 8601 as the date format whereas the older rsyslog based parsing expected syslog format. After modifying the parser the _grokparsefailures stopped and the messages were properly handled.
Timestamps and timezones
For the timestamps to be the same across the host and containers, it may be
advisable to pass -v /etc/localtime:/etc/localtime:ro -v
/etc/timezone:/etc/timezone:ro as parameters for all the container run
commands. Note! It seems that this is not necessary with the current Alpine
based images.
Conclusion
Separating logging using Logspout to direct the logs to Logstash and Elasticsearch works pretty well. One issue is that a lot of the programs log in a non-syslog friendly way by for example indenting the log messages. Parsing a Java stacktrace from multiple messages can be painful and requires further investigation. With rsyslog the messages can be combined before sending, but logspout forwards the messages as they appear, so that is not an option.
Next steps
As Docker has started to support direct syslog logging the need for Logspout may not be there any more. I need to try it out and will update the blog based on the findings.
Comments